Gateway
With Gateway insight-requests can be monitored.
Gateway-Dashboard.json
Gateway-Dashboard.json defines a Kibana-Dashboard to visualize requests through the insightgateway.
The dashboard can be activated with the following steps:
- Insight-gateway is successfully deployed
- Elastic, logstash and Kibana are running
- Open Kibana-client
- In "Settings" -> "Indices" -> "Configure an index pattern" define index pattern "logstash-*" with timebased events.
- In "Settings" -> "Objects" -> "import" you can import the Gateway-Dashboard.json
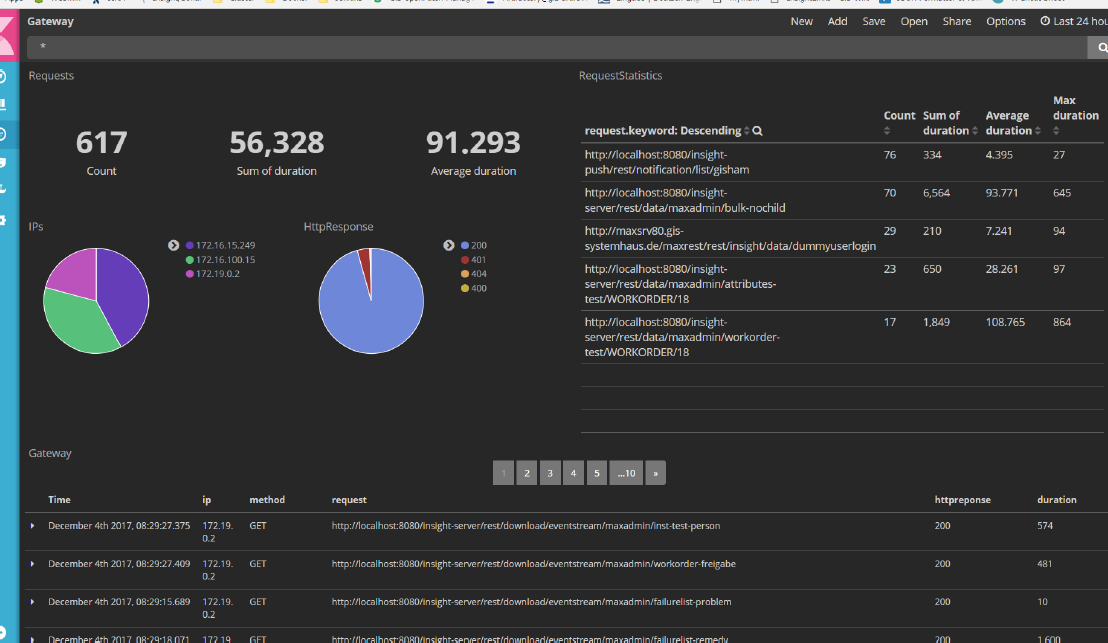
Start Kibana-Client and open dashboard "monitor". You will get a view like this: