Processes
The following processes and subprocesses can be monitored with "insight-status"
- Wildfly
- Gateway
- Indexer
- Reldb
- Elastic
- Kibana
Maximo
Its recommended to monitor Maximo and Apache httpd additionally and independent of insight-monitoring i.e. Zabbix.
Requirements
insight-status.bat The following scripts are used for monitoring insight-processes:
"Windows"
- insight-status.bat
- insight-status-servcice.bat
"Linux"
- insight-status.sh
- loop.sh
Insight-status Script
insight-status executes http-calls for every component (wildfly, elasticsearch, kibana, gateway, indexer) and writes a state-document to elasticsearch. Please adjust path to java in insight-status.
Loop Script
Loop is calling insight-status.sh periodically with 5 sec wait-time on Linux.
In insight-status.bat the loop is directly implemented.
Insight-status
"Windows"
 The script  insight\monitoring\insight-status-service.bat for Windows can be used to start insight-status.bat as a service

- To install the service please call:

        insight-status-service.bat install

- To remove the service please call:

        insight-status-service.bat remove
"Linux"
The following command can be used to run insight-status periodically in background without output:

        nohup ./loop.sh >/dev/null 2>&1 &
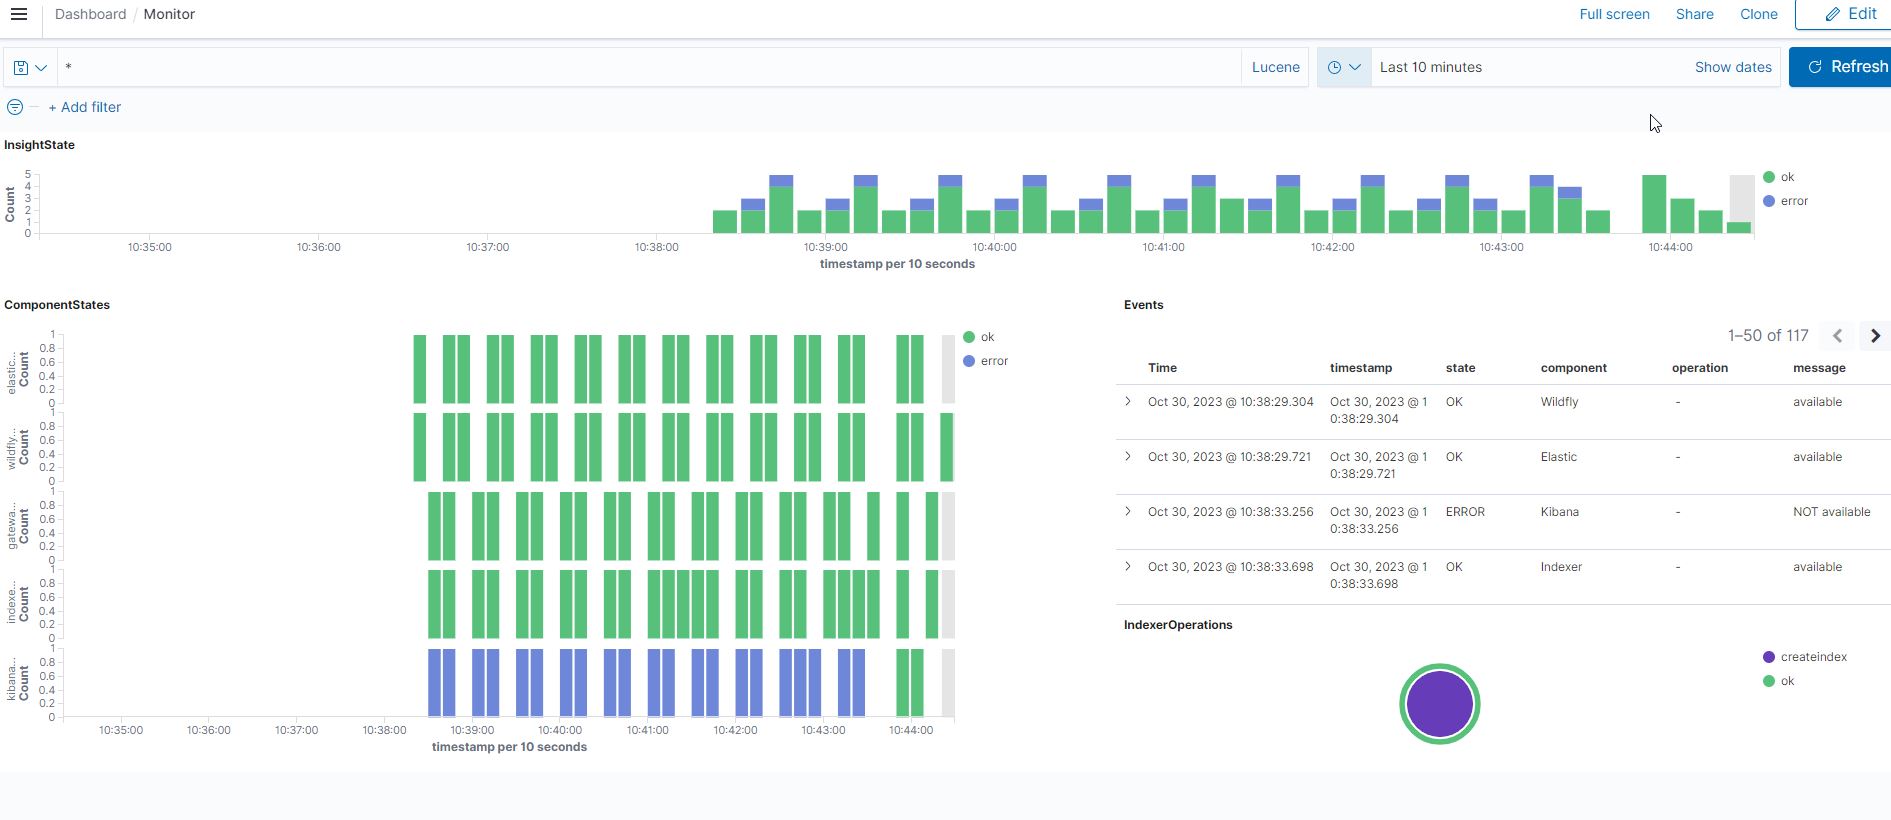
Monitoring-Dashboard
Monitoring-Dashboard-ES7.ndjson defines a Kibana-Dashboard to visualize the state-documents written by insight-status.
The following requirements must be met:
- Insight-indexer is successfully deployed
- Insight-status.bat as a service on Windows or loop.sh on linux is running
- Elastic and Kibana are running
- index insight-monitoring exists in Elastic (check http://localhost:9200/insight-monitoring/_search)
The dashboard can be activated by the following steps:
- Open Kibana-client (localhost/insight/kibana)
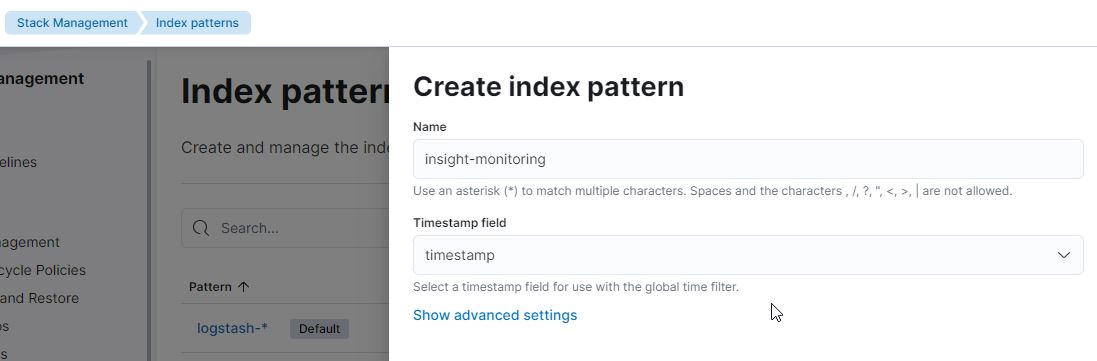
- In "Management" -> "Stack management" -> "Kibana Index Patterns" create index pattern "insight-monitoring" with timebased events
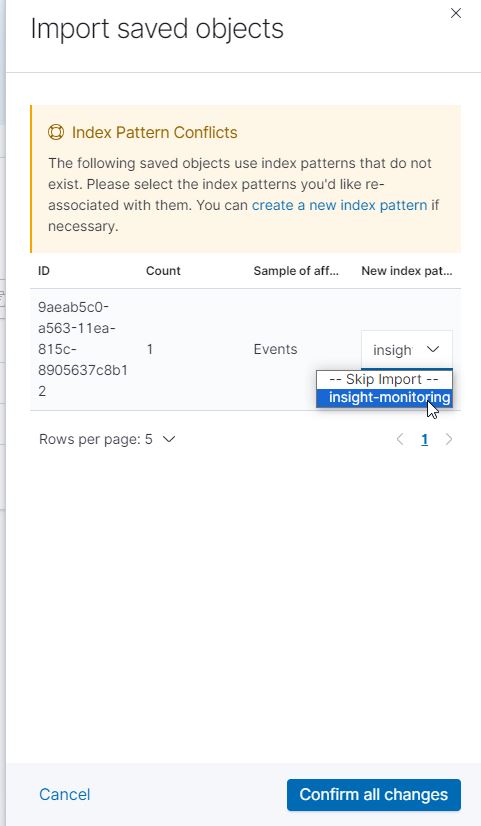
- In "Management" -> "Stack management" -> "Kibana Saved Objects" you can import the Monitoring-Dashboard.json
Start Kibana-Client and open dashboard "monitor". You will get a view like this: