Gateway
With Gateway-Dashboard insight-requests can be monitored with http-status, duration and parallelity.
Gateway-Dashboard
Gateway-Dashboard-ES7.ndjson defines a Kibana-Dashboard to visualize requests through the insightgateway.
The dashboard can be activated with the following steps:
- insight-gateway.war is successfully deployed in JEE-Server
- Elastic, logstash and Kibana are running
- Open Kibana-client (localhost/insight/kibana)
- In "Management" -> "Stack management" -> "Kibana Index Patterns" create index pattern "logstash-*" with timebased events
- In "Management" -> "Stack management" -> "Kibana Saved Objects" you can import the Monitoring-Dashboard-ES7.ndjson
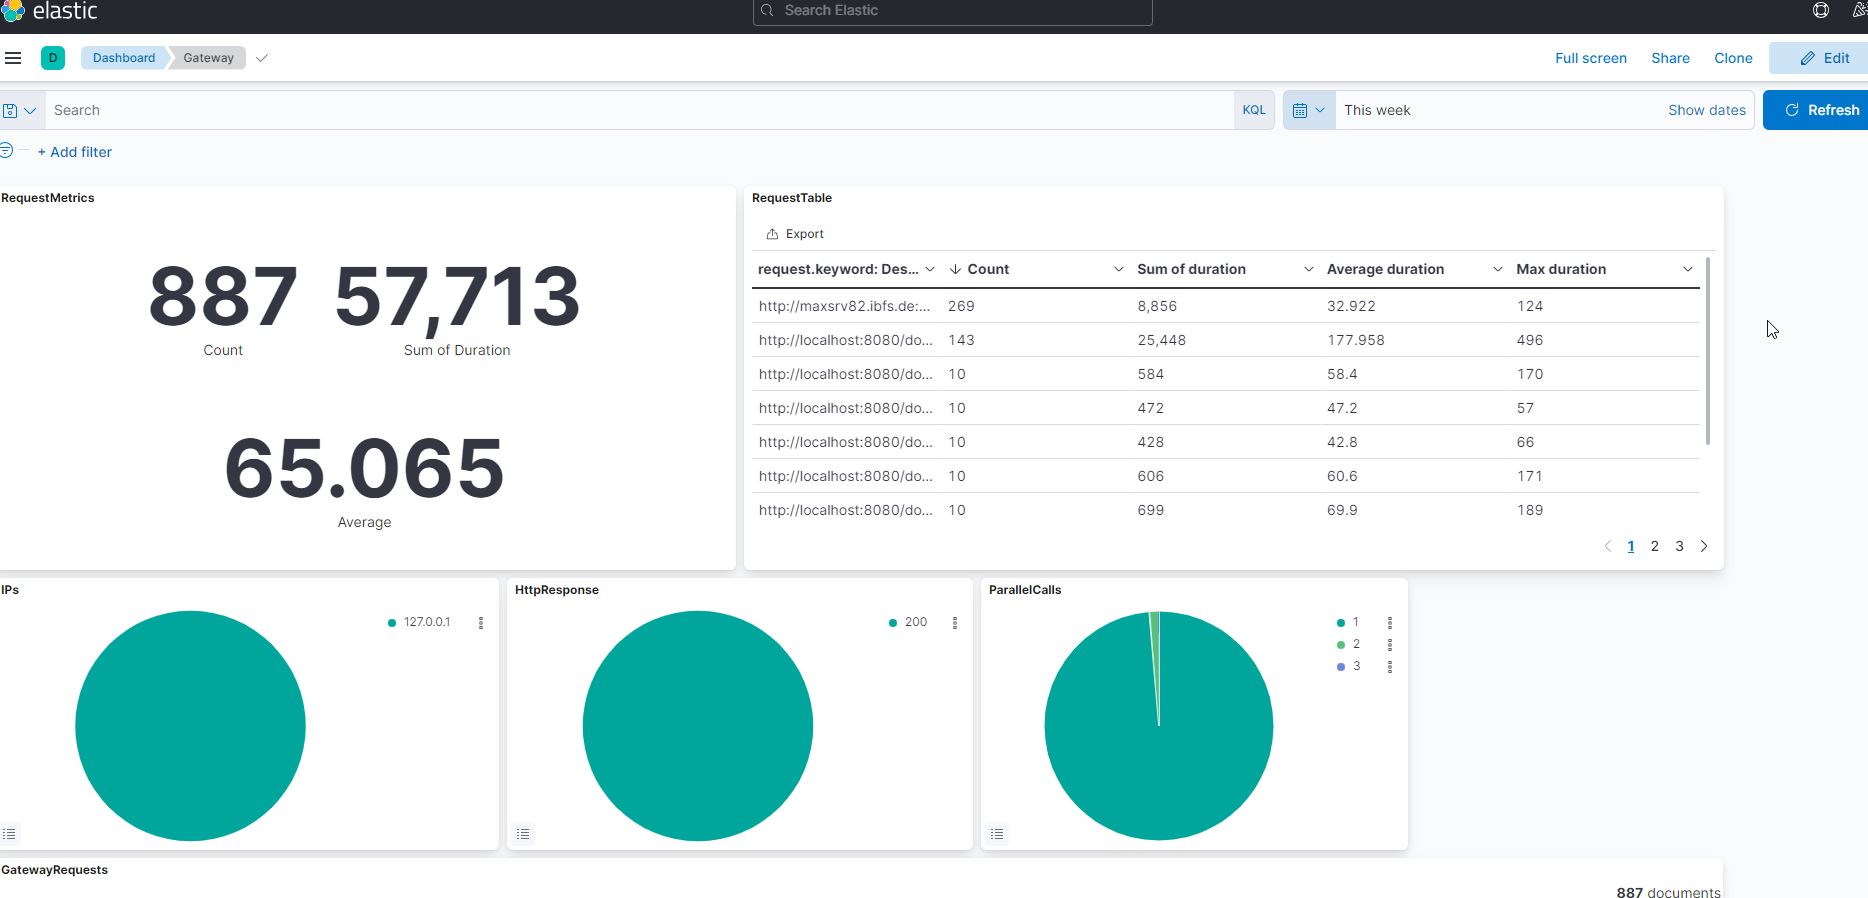
Start Kibana-Client and open dashboard "Gateway". You will get a view like this: