Logfiles
Insight uses logstash for monitoring logfiles. Logfile-entries will be digested and send to elastic-indices.
The logstash\config\insight-logging.conf monitors logfiles of the following processes:
| Apache | < HTTPServer >\logs\access.log |
| Wildfly | wildlfy\standalone\log\server.log |
| Elasticsearch | elasticsearch\logs\elasticsearch.log |
| Maximo | WebSphere\AppServer\profiles\ctgAppSrv01\logs\MXServer\SystemOut.log |
The configuration-file contains absolute pathnames. Please adjust pathnames if necessary.
Requirements
- logstash\bin\insight-logstash.bat must be running.
Logstash-Dashboard
The dashboard can be activated with the following steps:
- Elastic, logstash and Kibana are running
- Open Kibana-client (localhost/insight/kibana)
- In "Management" -> "Stack management" -> "Kibana Index Patterns" create index pattern "logstash-*" with timebased events
- In "Management" -> "Stack management" -> "Kibana Saved Objects" you can import the Logstash-Dashboard-ES7.ndjson
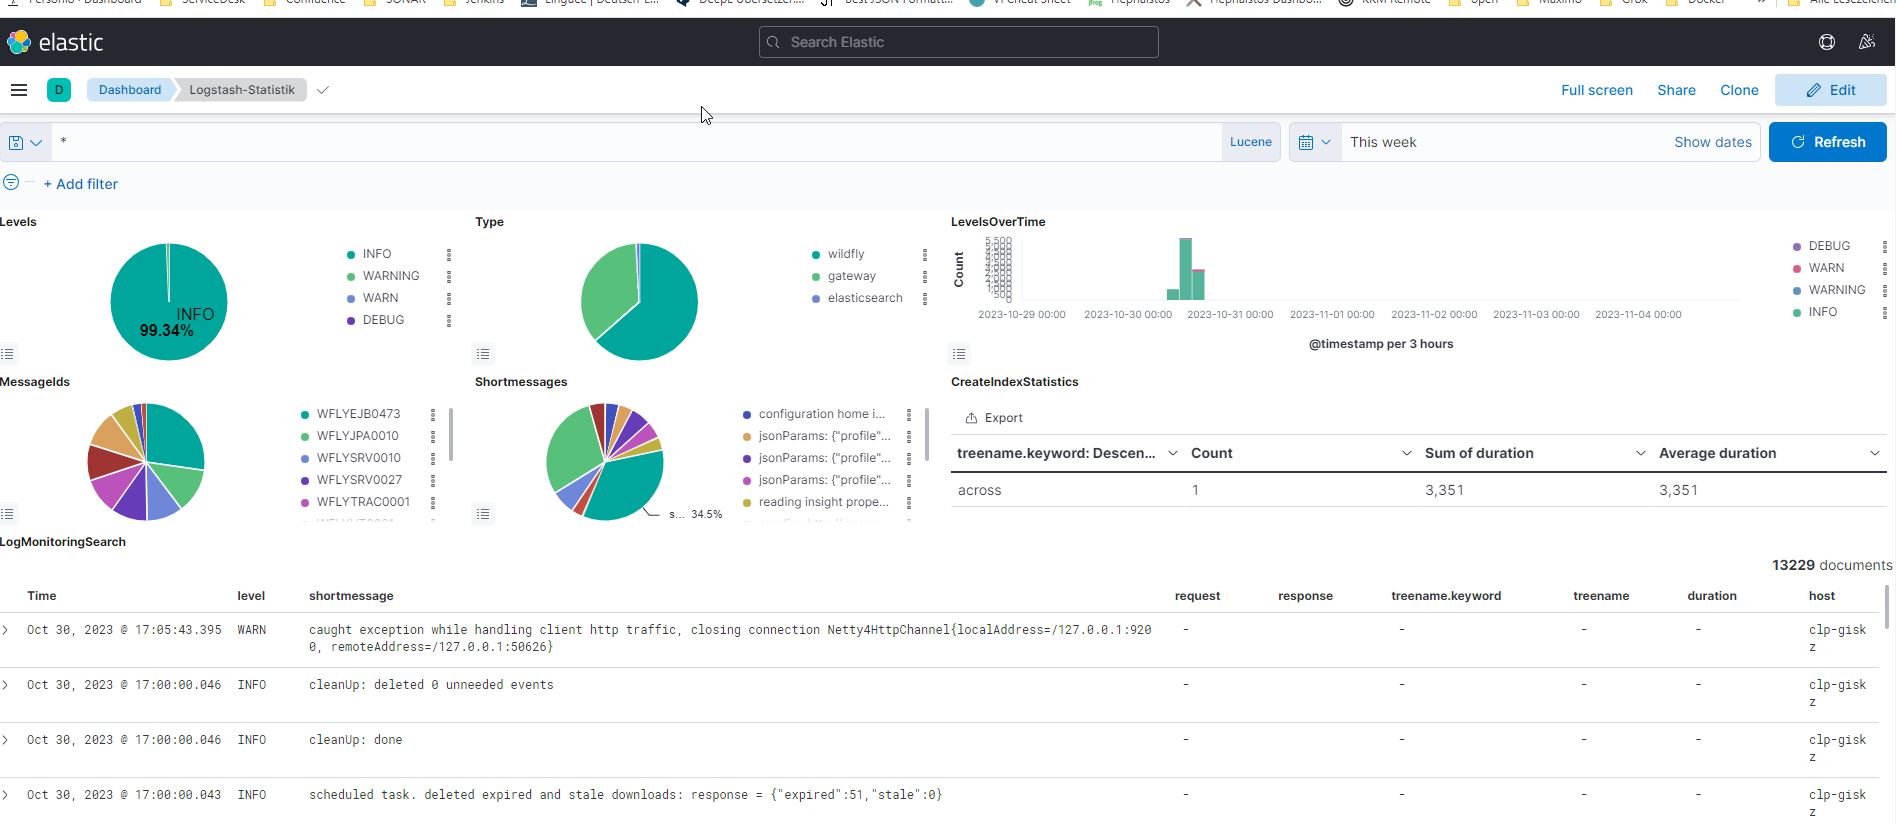
Start Kibana-Client and open dashboard "Logstash-Statistik"
Insight-logstash as a Service
To install the service on windows please call
insight-logstash-service.bat install
To remove the service please call
insight-logstash-service.bat remove