Dashboard Visualizations with Kibana
This chapter describes how to define a basic Kibana dashboard based on Insight Control Panel.
For additional information please see the Kibana User Guide:
https://www.elastic.co/guide/en/kibana/current/index.html
Requirements
This documentation assumes that Kibana 4.6 is installed and configured for Elasticsearch.
For more information concerning the installation please refer to
https://www.elastic.co/guide/en/kibana/current/setup.html.
Special Kibana configuration may be required for fields containing analyzed strings:
https://www.elastic.co/guide/en/elasticsearch/reference/current/mapping.html.
Configuration
You have to do the configuration in the following chapters to show a visualization of your EAM Data.
- A TreeConfiguration defined by Insight Configuration (defines objects, attributes and relations of your business database) the information is stored in Elasticsearch
- A Kibana search (queries data stored in Elasticsearch)
- A Kibana visualisation (visualize data of Kibana searches) and an optional Kibana dashboard (define and arrange Kibana visualizations)
- Integrate a Dashboard in your EAM (shows Kibana dashboards or visualizations by a provided url)
Insight Tree
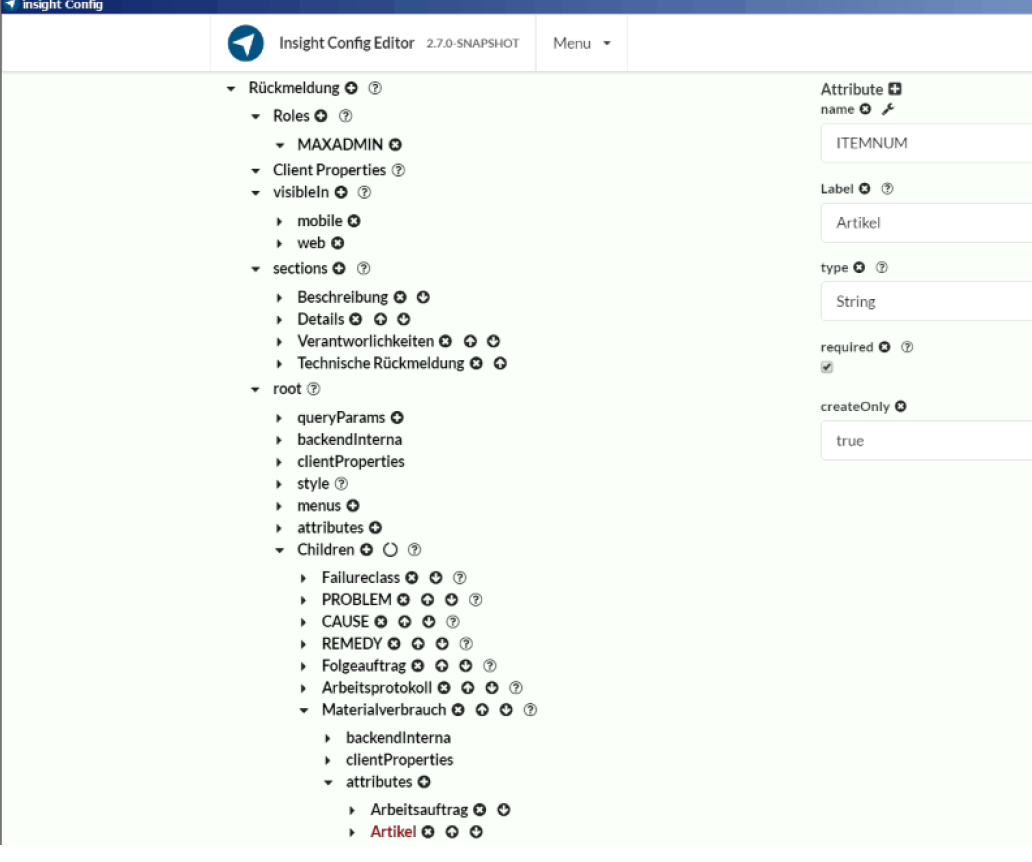
Information that will be shown in dashboards has to be first defined in Insight Tree configuration as attribute.
The following example shows the configuration of a "ITENNUM" attribute:
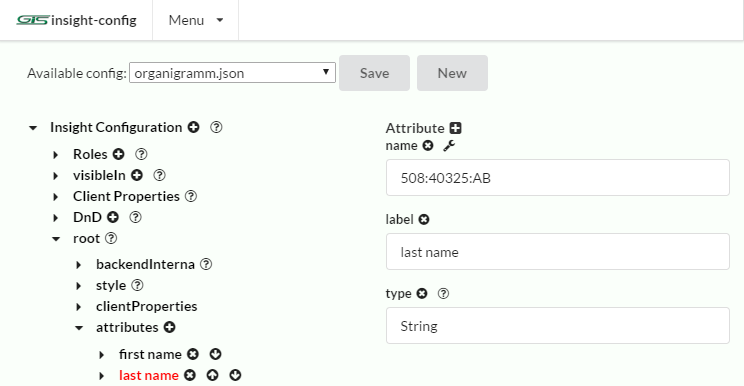
Information that will be shown in dashboards has to be first defined in Insight Tree configuration as attribute.
The following example shows the configuration of a last-name attribute:
Kibana
You can access Kibana with your browser on default port 5601 of your Kibana server.
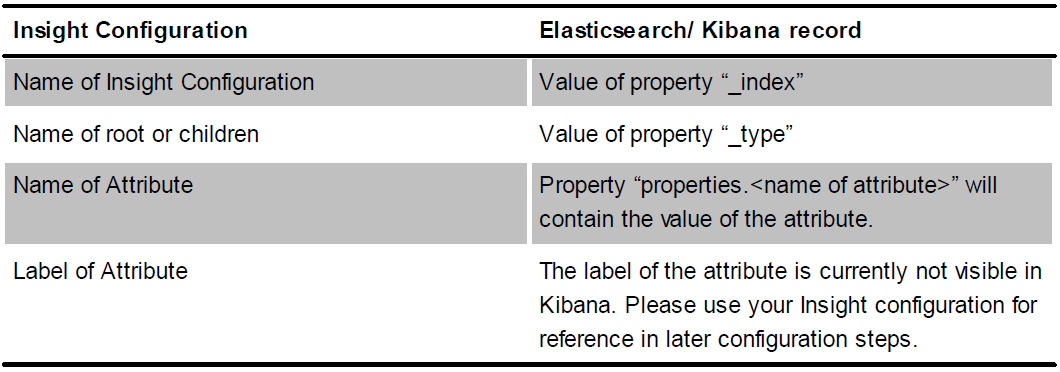
Please make sure that the attributes you want to analyze are defined in an Insight Tree configuration. Information defined in "Insight tree configuration" map to the records queried by Kibana from Elasticsearch.
The following excerpt from a tree configuration shows an example:
    {
      "name": "organigramm", -> _index = "organigramm"
      "root":{
        "name": "Person", -> _type = "Person"
        "attributes": [{
          "name": "508:40325:AB" -> properties.508:40325:AB = <last name of Person>
          "label": "last name" -> (not visible in Kibana)
          ...
        }],
        "children":[{
          "name": "delivery address", -> _type = "delivery address"
          "attributes": [{
            "name": "508:40335:AB" -> properties.508:40335:AB = <city of delivery address>
            "label": "city" -> (not visible in Kibana)
            ...
        }],
        ...
      },
      ...
    }
organigramm.json
Define an index
When you first access Kibana you have to define a name or a pattern for an index.
You may add indexes later in menu "Settings" | "Index patterns" | "Add New".
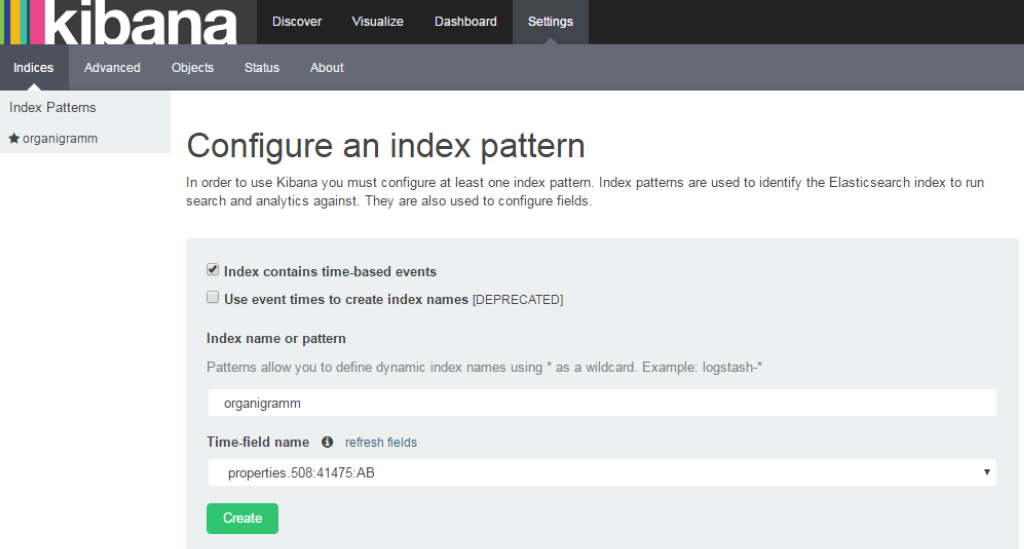
Use the name of the insight configuration as pattern.
If you want to analyze time-based data (e.g. error messages over time) specify a time based field.
If your data is not time-based (e.g. organizational structure) deselect "Index contains time-based events".
Define a Search
You can define which columns to use for visualization.
Access a search by selecting section on "Discover".
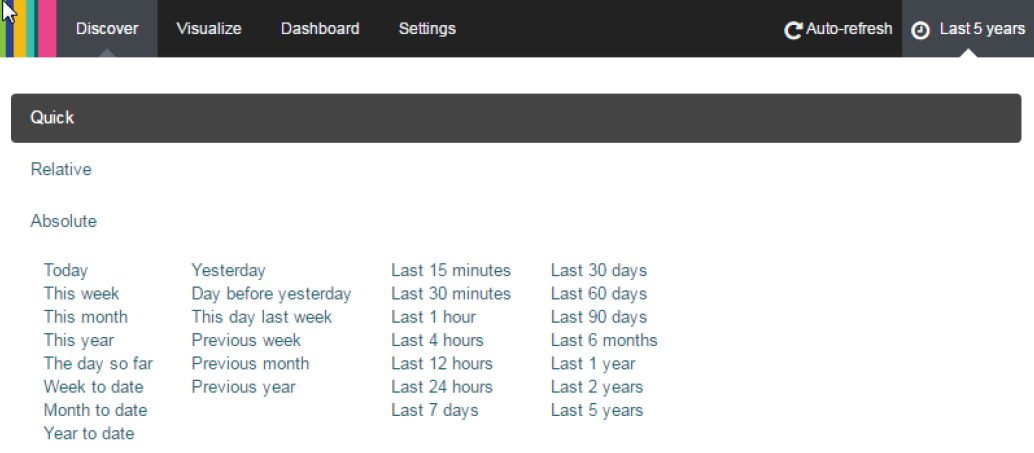
If your index is time-based, extend the time range of analyzed data by selecting a date range in the upper right corner.
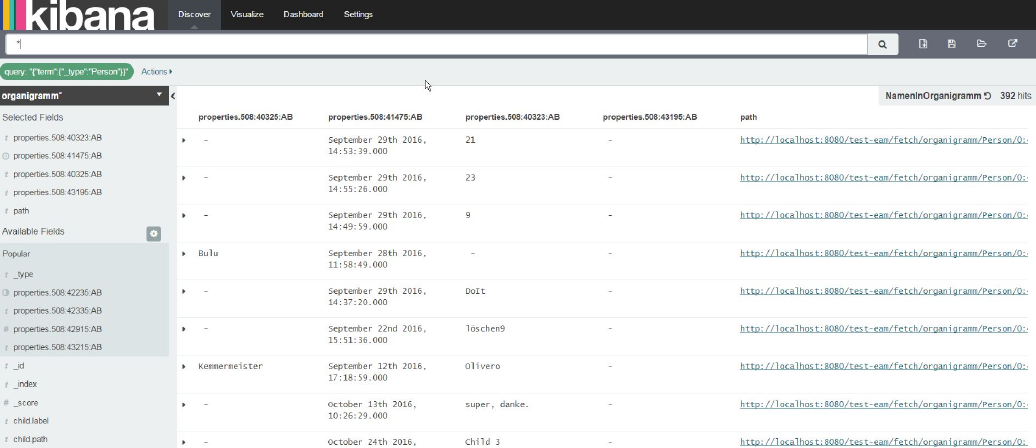
On the left side select you index pattern and add the fields "_type", and everything starting with "properties."(Button "add").
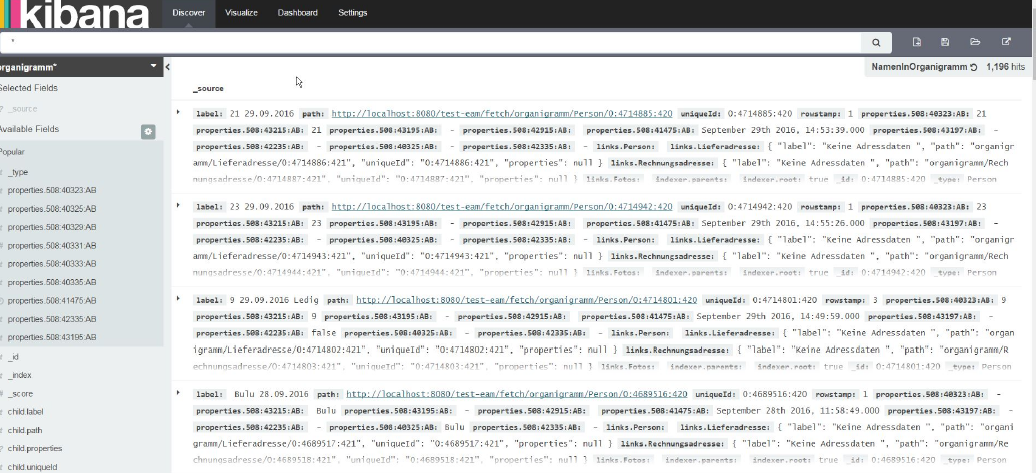
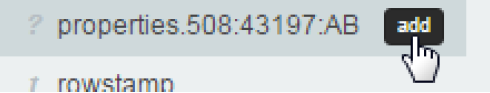
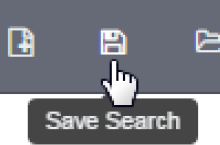
You will see a preview of the found records. Save your search and define a name (Button "Save Search"):
Create a Visualization
Kibana offers several kinds of visualization. The following example shows how to define a Vertical bar chart. For further information see the Kibana user guide.
- Create visualization by clicking Visualize.

-
Create a "Vertical bar chart" Visualization.
-
Choose "From a saved search" and select one of the previously created searches.
-
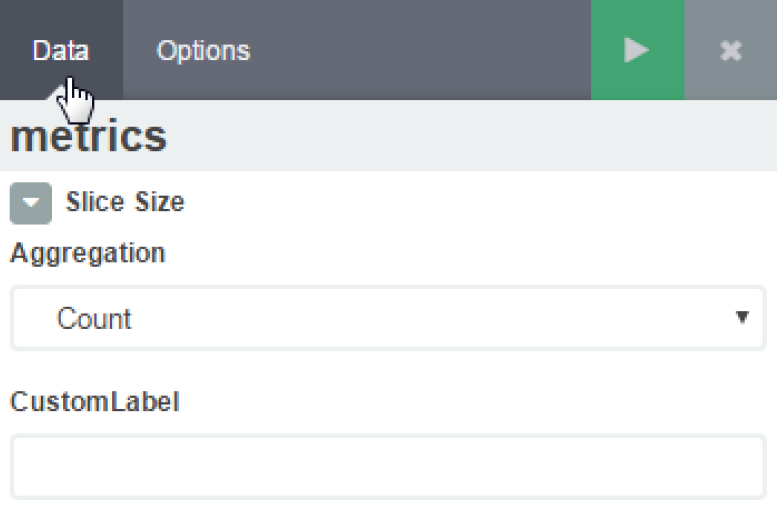
Expand Slice Size and Select a kind of Aggregation to be used: Select Aggregation: "Count".
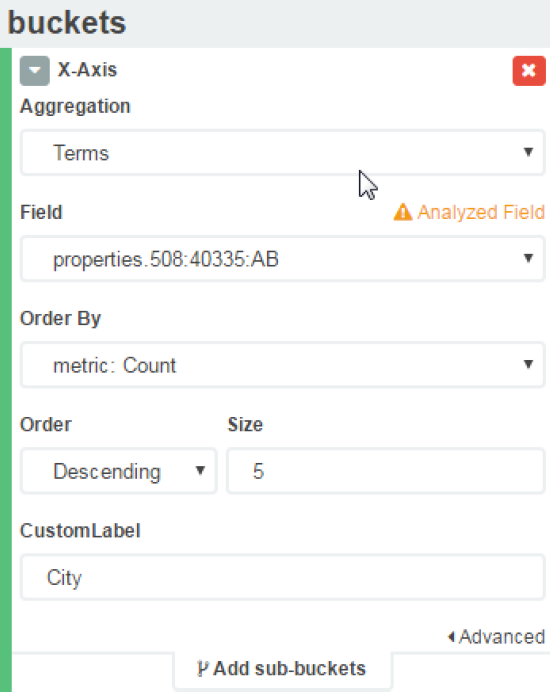
- Add a bucket of type "Split Slices" and add an aggregation with the following properties:
Aggregation: "Terms".
Field: "property.508:40335:AB".
CustomLabel: "City".
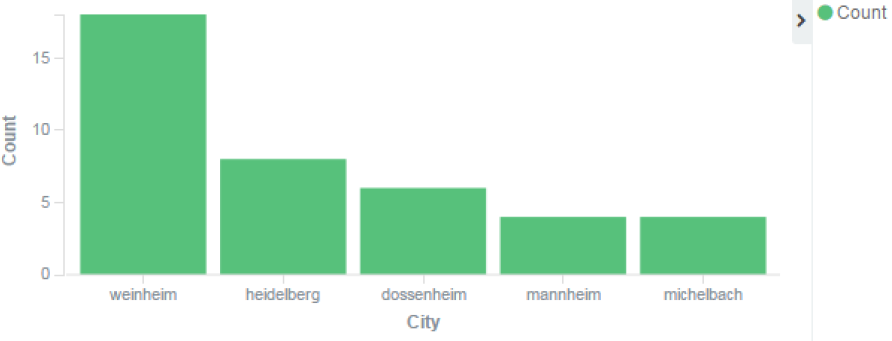
This will result in a visualization like this:
If you want to use this visualization, get the URL for sharing by clicking on "Share"

Copy the src= part of the "embed html source" to get a URL for a dashboard without Kibana branding.
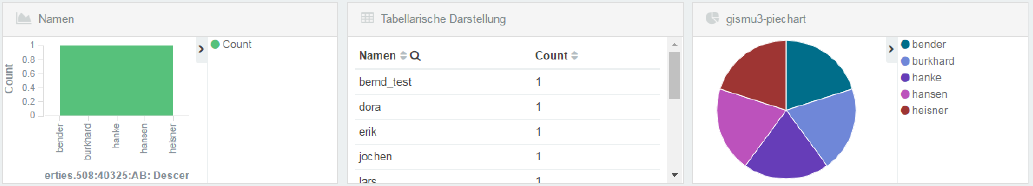
Create a Dashboard
For a combined visualization you can create a dashboard in menu dashboard.
 .
.
Add visualizations by clicking
 .
.
You have several options to arrange the visualizations.
Get the URL for sharing by clicking on "Share"
.
Copy the "src=" part of the "embed html source to get a URL for a dashboard without Kibana branding.
Add to Dashboard as Widget (OpenJet)
To integrate Kibana visualization in your openBMS installation, take the following steps:
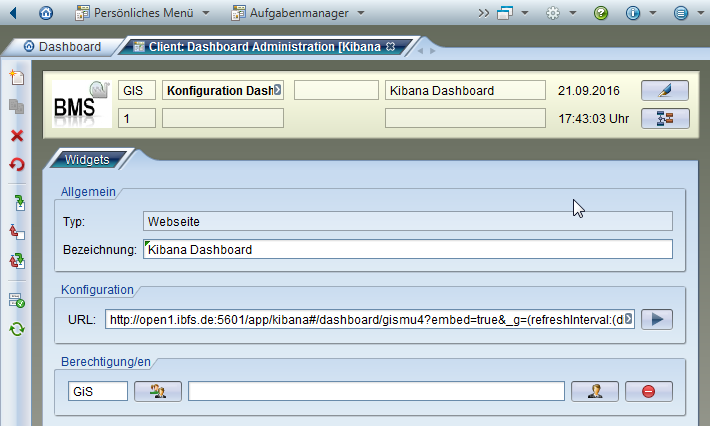
- Open the application “Client: Dashboard Administration” and select “Neu”
- Select “Frei definierbare URL” as the type of Widget
- Fill the fields and use the URL of chapter 4.2.3 or 4.2.4:
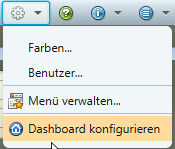
- Select “Dashboard konfigurieren” from the configuration menu.
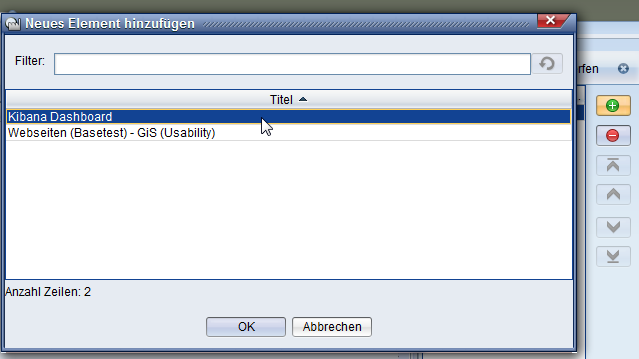
- Add the defined panel to your Dashboard and press “Speichern”
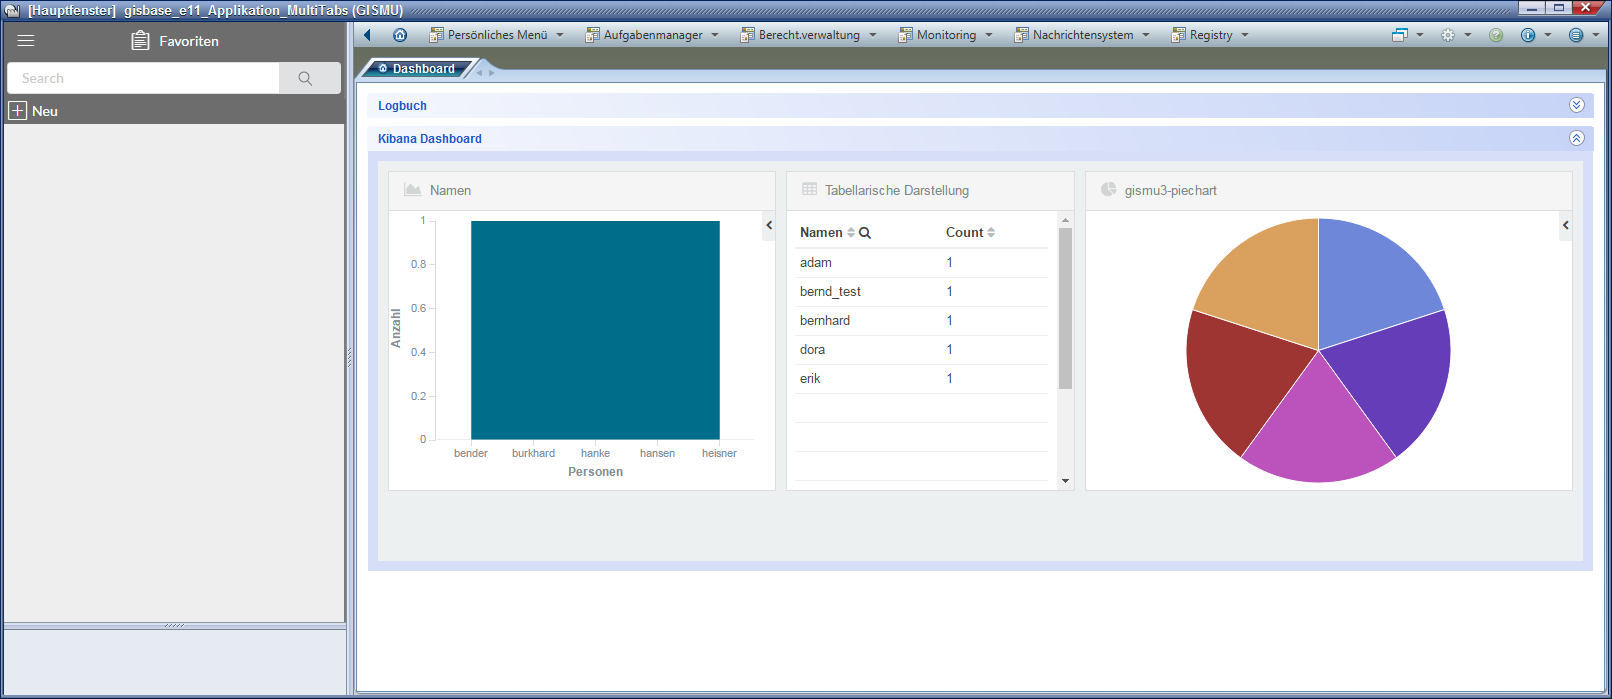
You will now see a Kibana panel on your openBMS Dashboard:
Open Tabs from Dashboard (OpenJet)
Dashboards can be configured in a way so that you can open Tabs with a single record.
-
Copy shared iframe-Url from Kibana-dashboard
<iframe src="https://<servername>/insight/kibana/app/kibana#/dashboard/MyDashboard?embed=true&_g=(refreshInterval:(display:Off,pause:!f,section:0,value:0),time:(from:now-15m,mode:quick,to:now))&_a=(filters:!(),options:(darkTheme:!f),panels:!((col:1,id:Kinderfreibetrag,panelIndex:1,row:1,size_x:3,size_y:3,type:visualization),(col:1,id:KinderfreibetragVis,panelIndex:2,row:4,size_x:9,size_y:2,type:visualization),(col:4,id:VorNachnameVis,panelIndex:3,row:1,size_x:3,size_y:3,type:visualization),(col:7,columns:!('properties.508:40325:AB','properties.508:41475:AB','properties.508:40323:AB','properties.508:43195:AB',path),id:NamenInOrganigramm,panelIndex:4,row:1,size_x:6,size_y:3,sort:!(_score,desc),type:search)),query:(query_string:(analyze_wildcard:!t,query:'*')),title:MyDashboard,uiState:())" height="600" width="800"></iframe> -
Cut url
From beginning till "dashboard"
From behind till last double-quotes
dashboard/MyDashboard?embed=true&_g=(refreshInterval:(display:Off,pause:!f,section:0,value:0),time:(from:now-15m,mode:quick,to:now))&_a=(filters:!(),options:(darkTheme:!f),panels:!((col:1,id:Kinderfreibetrag,panelIndex:1,row:1,size_x:3,size_y:3,type:visualization),(col:1,id:KinderfreibetragVis,panelIndex:2,row:4,size_x:9,size_y:2,type:visualization),(col:4,id:VorNachnameVis,panelIndex:3,row:1,size_x:3,size_y:3,type:visualization),(col:7,columns:!('properties.508:40325:AB','properties.508:41475:AB','properties.508:40323:AB','properties.508:43195:AB',path),id:NamenInOrganigramm,panelIndex:4,row:1,size_x:6,size_y:3,sort:!(_score,desc),type:search)),query:(query_string:(analyze_wildcard:!t,query:'*')),title:MyDashboard,uiState:()) -
Add prefix
https://<servername>/insight/web/dashboard.html#?url=/ -
Use url für die Widget-configuration in open
https://<servername>/insight/web/dashboard.html#?url=/dashboard/MyDashboard?embed=true&_g=(refreshInterval:(display:Off,pause:!f,section:0,value:0),time:(from:now-15m,mode:quick,to:now))&_a=(filters:!(),options:(darkTheme:!f),panels:!((col:1,id:Kinderfreibetrag,panelIndex:1,row:1,size_x:3,size_y:3,type:visualization),(col:1,id:KinderfreibetragVis,panelIndex:2,row:4,size_x:9,size_y:2,type:visualization),(col:4,id:VorNachnameVis,panelIndex:3,row:1,size_x:3,size_y:3,type:visualization),(col:7,columns:!('properties.508:40325:AB','properties.508:41475:AB','properties.508:40323:AB','properties.508:43195:AB',path),id:NamenInOrganigramm,panelIndex:4,row:1,size_x:6,size_y:3,sort:!(_score,desc),type:search)),query:(query_string:(analyze_wildcard:!t,query:'*')),title:MyDashboard,uiState:())